Introduction
The limitation of bandwidth has often constrained today’s cellular communication providers’ pursuit to provide high quality contents on wireless devices through mobile broadband networks. This limitation is occasioned by current global communication systems that support only the frequency bands between 700 MHz and 2.6 GHz . Millimeter-wave (mmWave) frequency bands avail massive chunk of bandwidth and motivate invention of future communication systems. Certainly, mmWave frequency range will play a crucial role in 5G wireless communications. Therefore, application of frequency bands beyond the microwave band (usually 3 GHz band) is anticipated. Super high frequency (SHF) band (3–30 GHz spectrum) and extremely high frequency (EHF) band (30–300 GHz spectrum) or mmWave band share similar propagation characteristics, therefore, referred to as the mmWave band.
The introduction of mmWave technology as a key player for the 5G wireless broadband communication has enabled provision of multi-gigabit communication services, such as device-to-device communication (D2D) , high definition television (HDTV) and ultra-high definition video (UHDV).
The existing and ongoing campaign efforts targeting 5G channel measurement and modeling on the 20 GHz to 30 GHz and 50 GHz to 70 GHz ranges have been reported by organizations such as New York University (NYU) and the Mobile and wireless community Enablers for the Twenty-Twenty Information Society (METIS) . However, a few report on the 10 GHz to 25 GHz and 40 GHz to 55 GHz bands. Accordingly, these frequency bands will require study in the future . This work has been limited by channel sounder specifications to 14 GHz to 22 GHz frequency bands.
Path loss models for indoor mmWave propagation channels are important components for the design, planning, performance evaluation and deployment of wireless networks. Consequently, several organizations are currently participating in developing mmWave channel models. Path loss dictates the signal-to-noise plus interference ratio and data rates, hence network coverage area. Moreover, mmWave system simulations require accurate path loss models because it is a central parameter in wireless propagation channel . A number of empirical-statistical path loss models proposed in prior research were based on linear regression to measurements such as the Okumura–Hata models , the COST 231 path loss models , and others .
Indoor environment is significantly different from the outdoor in many ways. As a consequence, indoor path loss models need to consider the variations in floor plans, construction materials used, type and number of office equipment, people working and their movements, scale of smart devices used in the vicinity, etc. In addition, multipath propagation along with usual fading and path loss due to distance, interference, shadowing, reflection, refraction, scattering, and penetration, also impact on the received signal characteristics .
In this paper, dual slope path loss model is applied. The model considers modal attenuation due to multipath and propagating wave guiding effect in indoor corridors as opposed to shadowing which has been given attention in the literature. We discuss two very important aspects of a corridor typical path loss model propagation phenomena: wave guiding effects in a corridor and break point. We have particularly conducted measurement campaigns in the 14 GHz and 22 GHz frequency bands and applied a dual slope path loss model. Break point or dual slope models have been a popular generalization for decades with determination of model parameters via a linear regression of the experimental data. Corridors are regarded as oversize dielectric waveguides with transversal dimensions much larger than wavelength, thus a number of modes are entirely involved in the propagation process. Certainly, propagating field in corridors is through superimposition of proper characteristics modes . Moreover, the modal attenuation approach is mostly bounded by the fundamental mode which is least attenuated and occurs after the break point .
The rest of this paper is organized as follows: Detailed description of measurement equipment, hardware, environment and procedure is provided in Section II. In Section III, the analysis of large-scale path loss model, modal attenuation based dual slope model and single slope single-frequency models, propagation in indoor corridors and break point analysis are presented. In Section IV, effects of frequency, antenna height, wave guiding and construction materials are comprehensively discussed. Finally, Section V presents summarized findings of the applied dual slope model as a simple and accurate model and observed to outperform the well-known close-in reference distance model in indoor corridors at 14 GHz and 22 GHz frequency bands.
SECTION II.
Measurement Campaign
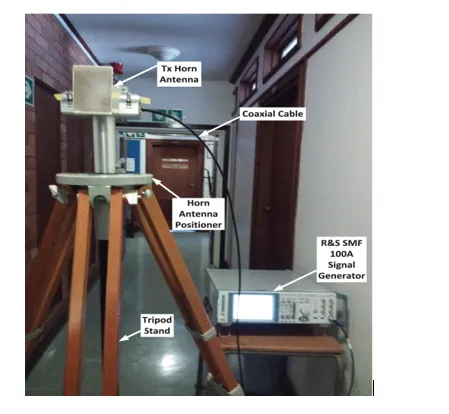
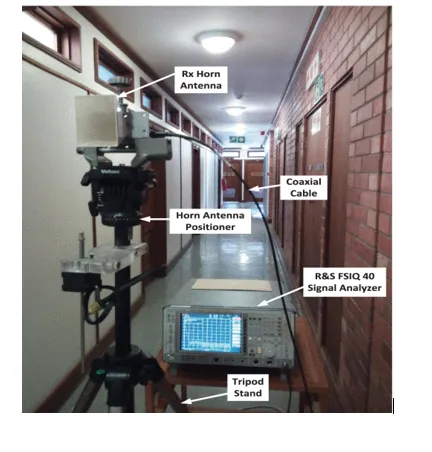
In this section, we present a detailed description of the channel sounder and scenarios considered in this measurement campaign. We used Rohde and Schwarz SMF 100A for signal generation at the transmitter (Tx), Rohde and Schwarz FSIQ 40 Signal Analyzer at receiver (Rx) and two directional pyramidal horn antennas. Fig. 1 depicts the channel sounder used in our measurement campaign.
A. Measurement Equipment and Hardware
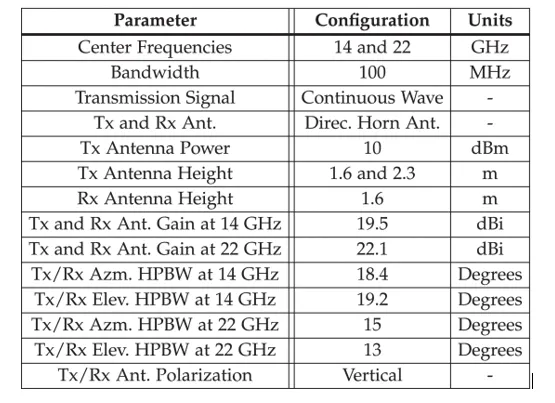
Measurements were performed with a channel sounder system based on Rohde and Schwarz SMF 100A for radio frequency signal generation at the Tx side with a frequency range of 100 kHz to 22 GHz. Rx equipment was Rohde and Schwarz FSIQ 40 Signal Analyzer with a frequency range of 20 Hz to 40 GHz and maximum analysis bandwidth of 120 MHz. Measurement system consisted of a pair of wideband directional pyramidal horn antennas with a 19.5 dBi gain, 3 dB beamwidth of 19.2° in elevation and 18.4° in azimuth and 22.1 dBi gain, 3 dB beamwidth of 13° in elevation and 15° in azimuth, at 14 GHz and 22 GHz respectively. A continuous wave was transmitted by the transmitter at 10 dBm and received power recorded at the receiver. Figs. 2 and 3 show photos of the Tx and Rx units used during measurement campaigns. Table. 1 provides the parameters configuration and equipment specifications.
TABLE 1 Channel Sounder Specifications and Parameters Configuration
B. Measurement Scenario and Experimental Procedure
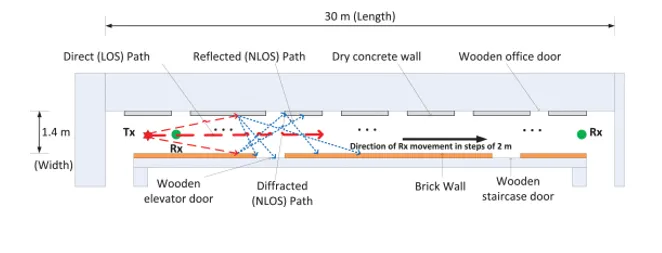
We conducted measurement campaigns within the indoor corridor on 5th floor of the Discipline of Electrical, Electronic and Computer Engineering building, University of Kwa-Zulu Natal, South Africa. The measurement environment was a typical indoor corridor, a waveguide like structure with walls made of bricks and dry concrete, wooden doors to offices, a staircase and an elevator (see Fig. 4). The Tx antenna was installed at 1.6 m and 2.3 m (typical hotspot indoor location) and Rx antenna at 1.6 m (typical handset height) above the floor. With Tx antenna fixed at one end of the corridor, Rx antenna was placed at thirteen (13) different locations for both line-of-sight (LOS) and non-line-of-sight (NLOS) measurements. The directional horn antenna at the Rx side was rotated over azimuth angles with 10° azimuth steps. Measurements were performed with identical Tx and Rx locations for both 14 GHz and 22 GHz to enable direct juxtaposition between the two frequency bands. Pyramidal horn antennas with vertical polarization were used for all measurement tests.
We selected a single Tx location, with antenna installed at 1.6 m and 2.3 m high and thirteen (13) Rx identical locations for both Tx antenna heights. The Tx-Rx separation distances varied from 2 m to 24 m in steps of 2 m per measurement location. The indoor corridor dimensions were 1.4 m (wide) by 30 m (long) by 2.6 m (high). Fig. 5 displays the floor map and Tx and Rx locations. For each Tx-Rx antenna combination, the Rx was rotated in steps of 10° in the azimuth plane while elevation was fixed at 0° for both 14 GHz and 22 GHz frequency bands. The incremental rotation enabled 36 different angles of arrival (AOAs) data over 360° azimuth plane in every Rx location. Tx antenna was fixed at 0° in both elevation and azimuth at 1.6 m in height while at 2.3 m Tx high, the azimuth and elevation of the antenna were fixed at 0° and −20° respectively.
We post-processed the measurement data of received power at every point in steps of 2 m from Tx to Rx along the axial length of the corridor. Received power at every measurement point was then averaged from data set at that point. Finally, the path loss was determined by converting the power received at each point.