Quadrature phase-shift keying is now the mainstream method used for modulation in cable modems, satellites, and numerous other wireless communication schemes. The signature constellation pattern of QPSK and related digital modulations schemes can be a bit baffling to novices. Here’s a simple primer on the fundamentals of the method, why the constellation pattern arises, and how to display it.
If a digital signal is used as the input to a conventional frequency modulator, the output will consist of a sine wave containing two distinct frequencies. Getting the original digital signal back requires a demodulation process that consists of passing the modulated signal through two filters, then translating the resulting signal back into logic levels.
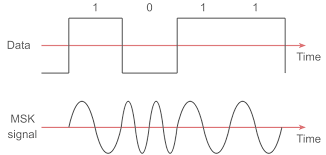
This process of modulation is generally called frequency-shift keying, FSK. There is a method similar to FSK called phase-shift keying. As you might suspect, FSK involves modulating the phase of the carrier rather than its frequency. The finite phase changes represent digital data. Using a digital signal to switch between two signals of equal frequency but opposing phase will generate a simple phase-modulated waveform.
Now consider multiplying the resulting phase-modulated waveform by a sine wave of equal frequency. This generates two component waveforms. One is a cosine waveform of double the received frequency. The other is a frequency-dependent term having an amplitude proportional to the cosine of the phase shift. Now, filtering out the doubled frequency term produces the original data used for modulating the transmission.
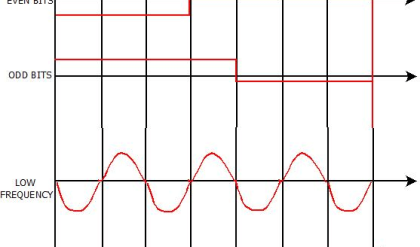
The concept of quadrature phase shifting arises from the idea that there can be more than two states of phase shifting. The carrier can experience numerous phase changes. Then multiplying the received signal by a sine wave of equal frequency will demodulate the phase shifts into voltage levels that are independent of frequency.
Thus in QPSK, the carrier undergoes four changes in phase. Each phase change can represent two binary bits of data. The point of this approach is that the carrier can transmit two bits of data instead of one, so the bandwidth of the transmission has effectively doubled.
The explanation and proof of QPSK concepts fall out of writing sine and cosine relationships in their exponential form (Euler relations), then recognizing trigonometric identities. Writing sin ωt as an exponential, then multiplying two sine waves together, yields: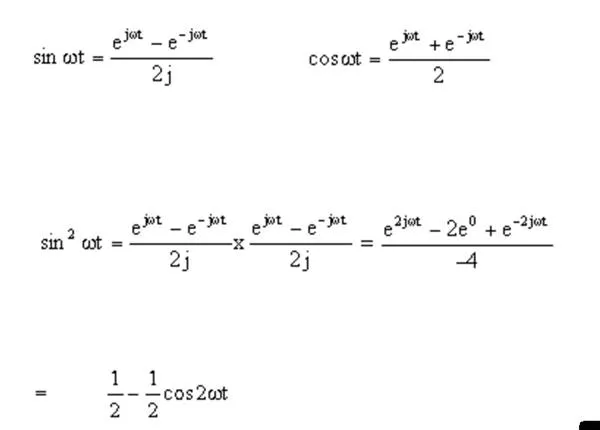
The two sine waves correspond to that for the incoming signal and that for the local oscillator in the receiver mixer. The result, ½ – (cos 2ωt)/2, represents an output frequency that is twice that of the input frequency but which has half the amplitude. It is also superimposed on a dc offset of half the input amplitude.
Multiplying sin ωt by cos ωt gives: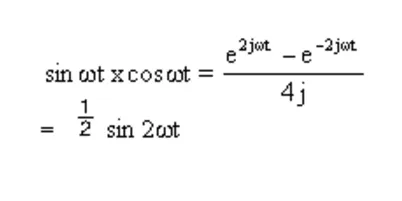
The (sin 2ωt)/2 output frequency is double that of the input but at half the amplitude. Multiplying sin ωt by a phase-shifted version of itself, sin ωt + θ, yields a demodulated waveform with an output frequency double that of the input frequency, with a dc offset varying according to the phase shift, θ.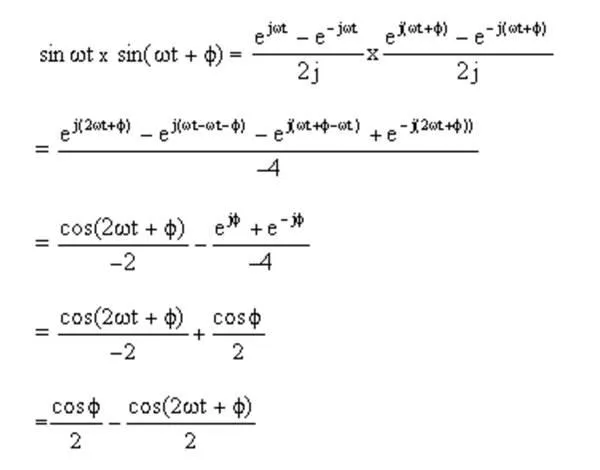
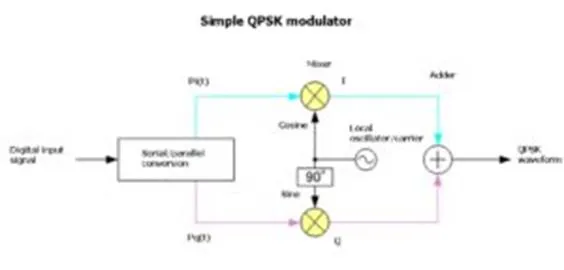
One problem: A phase shift of π/2 can’t be distinguished from that of – π/2. The accurate decoding of phase shifts present in all four quadrants requires that the input signal first is multiplied by both sine and cosine waveforms, then go through filtering to get rid of the 2x frequency, then go through data reconstruction.
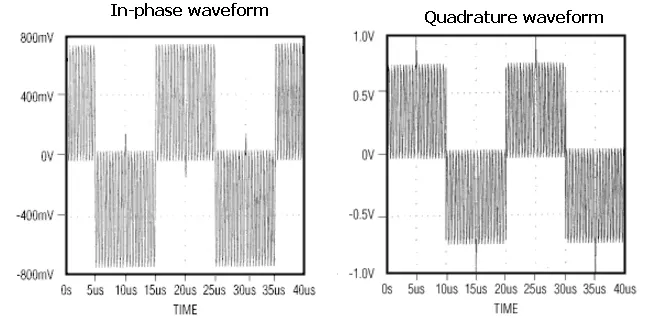
Pictured here are the simulated in-phase (left) and quadrature (right) waveform for a QPSK demodulator with a 1-MHz input sine wave experiencing a phase shift of 45°, 135°, 225°, and 315° every 5 µsec. Photo courtesy of Maxim Integrated.
It turns out that it can be tough to synchronize a local oscillator with an input signal. If the phase of the local oscillator varies with that of the input signal, signals on the phasor diagram will be rotated from their expected position by an amount proportional to the phase difference. If both the phase and frequency of the local oscillator are not fixed, the rotation on the phasor diagram is continuous.
For these reasons, the output of the demodulator normally goes to an analog/digital converter for digitization. Then rotation resulting from errors in the phase or frequency of the local oscillator get removed through signal processing.
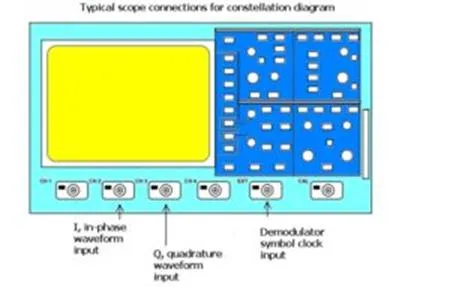
Constellation diagrams are commonly used in analyzing the performance of data communications systems using quadrature signal generation techniques such as QPSK. The generation of a constellation diagram requires an oscilloscope with XY display capability, an external sampling clock, and a persistence display.
The measurement requires access to the in-phase, I, and quadrature, Q, signal components as well as the symbol clock. X-Y cursors read both the X and Y voltage values and the resultant output waveform phase (angle) and magnitude (radius). The angle is the phase of the output signal relative to the in-phase component. The radius is the magnitude of the composite signal displayed as the distance from the center of the display to the cursor location.
Note that the timing of the symbol clock may need to be tweaked to assure that the signal waveforms are sampled at the correct time. This is usually accomplished by trimming the length of the coaxial cable connecting the demodulator clock output to the oscilloscope’s ext trigger/sampling input. Some scopes have the ability to use analog or color graded persistence to highlight the data states that occur most often.
Finally, it is worth briefly discussing how to generate QPSK signals for testing. Vector signal generators or digital signal generators often have a built-in I/Q modulator to upconvert complex modulation formats such as QPSK and 64QAM. When combined with an IQ baseband generator, they can emulate QPSK signals within the bandwidth they support.
An alternative means of generating QPSK signals is with a programmable arbitrary function generator and suitable software. For example, suppliers such as Mathworks have software packages that communicate with instruments through interfaces and drivers. They generally allow the creation of waveforms in terms of sine and cosine functions, phase shifts, amplitude settings, and so forth. The resulting program to generate a specific waveform gets fed to a function generator through IO libraries – the Agilent IO Libraries Suite is one example.